
Reports shows how your firm uses Smarter Drafter over time. Use it to track adoption, find forms nobody is using, see who is creating submissions, and download a full history of your submissions and intakes.
Reports has four pages: Submissions Overview, Submissions by Form, Submissions by Users and Submission Logs. Every page counts real submissions only, never test submissions, and you can download every page as a CSV. To open Reports, you need the Reports permission.
Filters and date range
Most controls work the same on every page. A page only shows the filters that apply to it.
- Date range: The first control on every page. Choose Last 7 days, Last 30 days, Last 90 days, Last 12 months or Custom. For a custom range, enter a From date and To date, then click Apply. The default is Last 90 days. You can’t select dates before your firm’s first live submission or after today.
- Group by (Submissions Overview only): Shows the chart by Day, Week, Month or Year. The options available depend on the length of the range. Ranges of 14 days or less always show by day.
- Form (Submissions Overview only): Limits the results to one or more forms.
- Department: Limits the results to users in one or more departments. Available on every page except Submission Logs.
- Position (Submissions by Users only): Limits the results to users in one or more positions.
- Search: Finds forms by name on Submissions by Form, and users by name or email on Submissions by Users.
- Filters: Shows deleted forms on Submissions by Form, and Show deactivated users on Submissions by Users.
Changes apply straight away. A multi-select filter applies when you close its dropdown. Your date range and Department selection stay the same when you switch tabs.
If no results match, click Clear filters. This resets your filters and search but keeps your date range.
Submissions Overview.
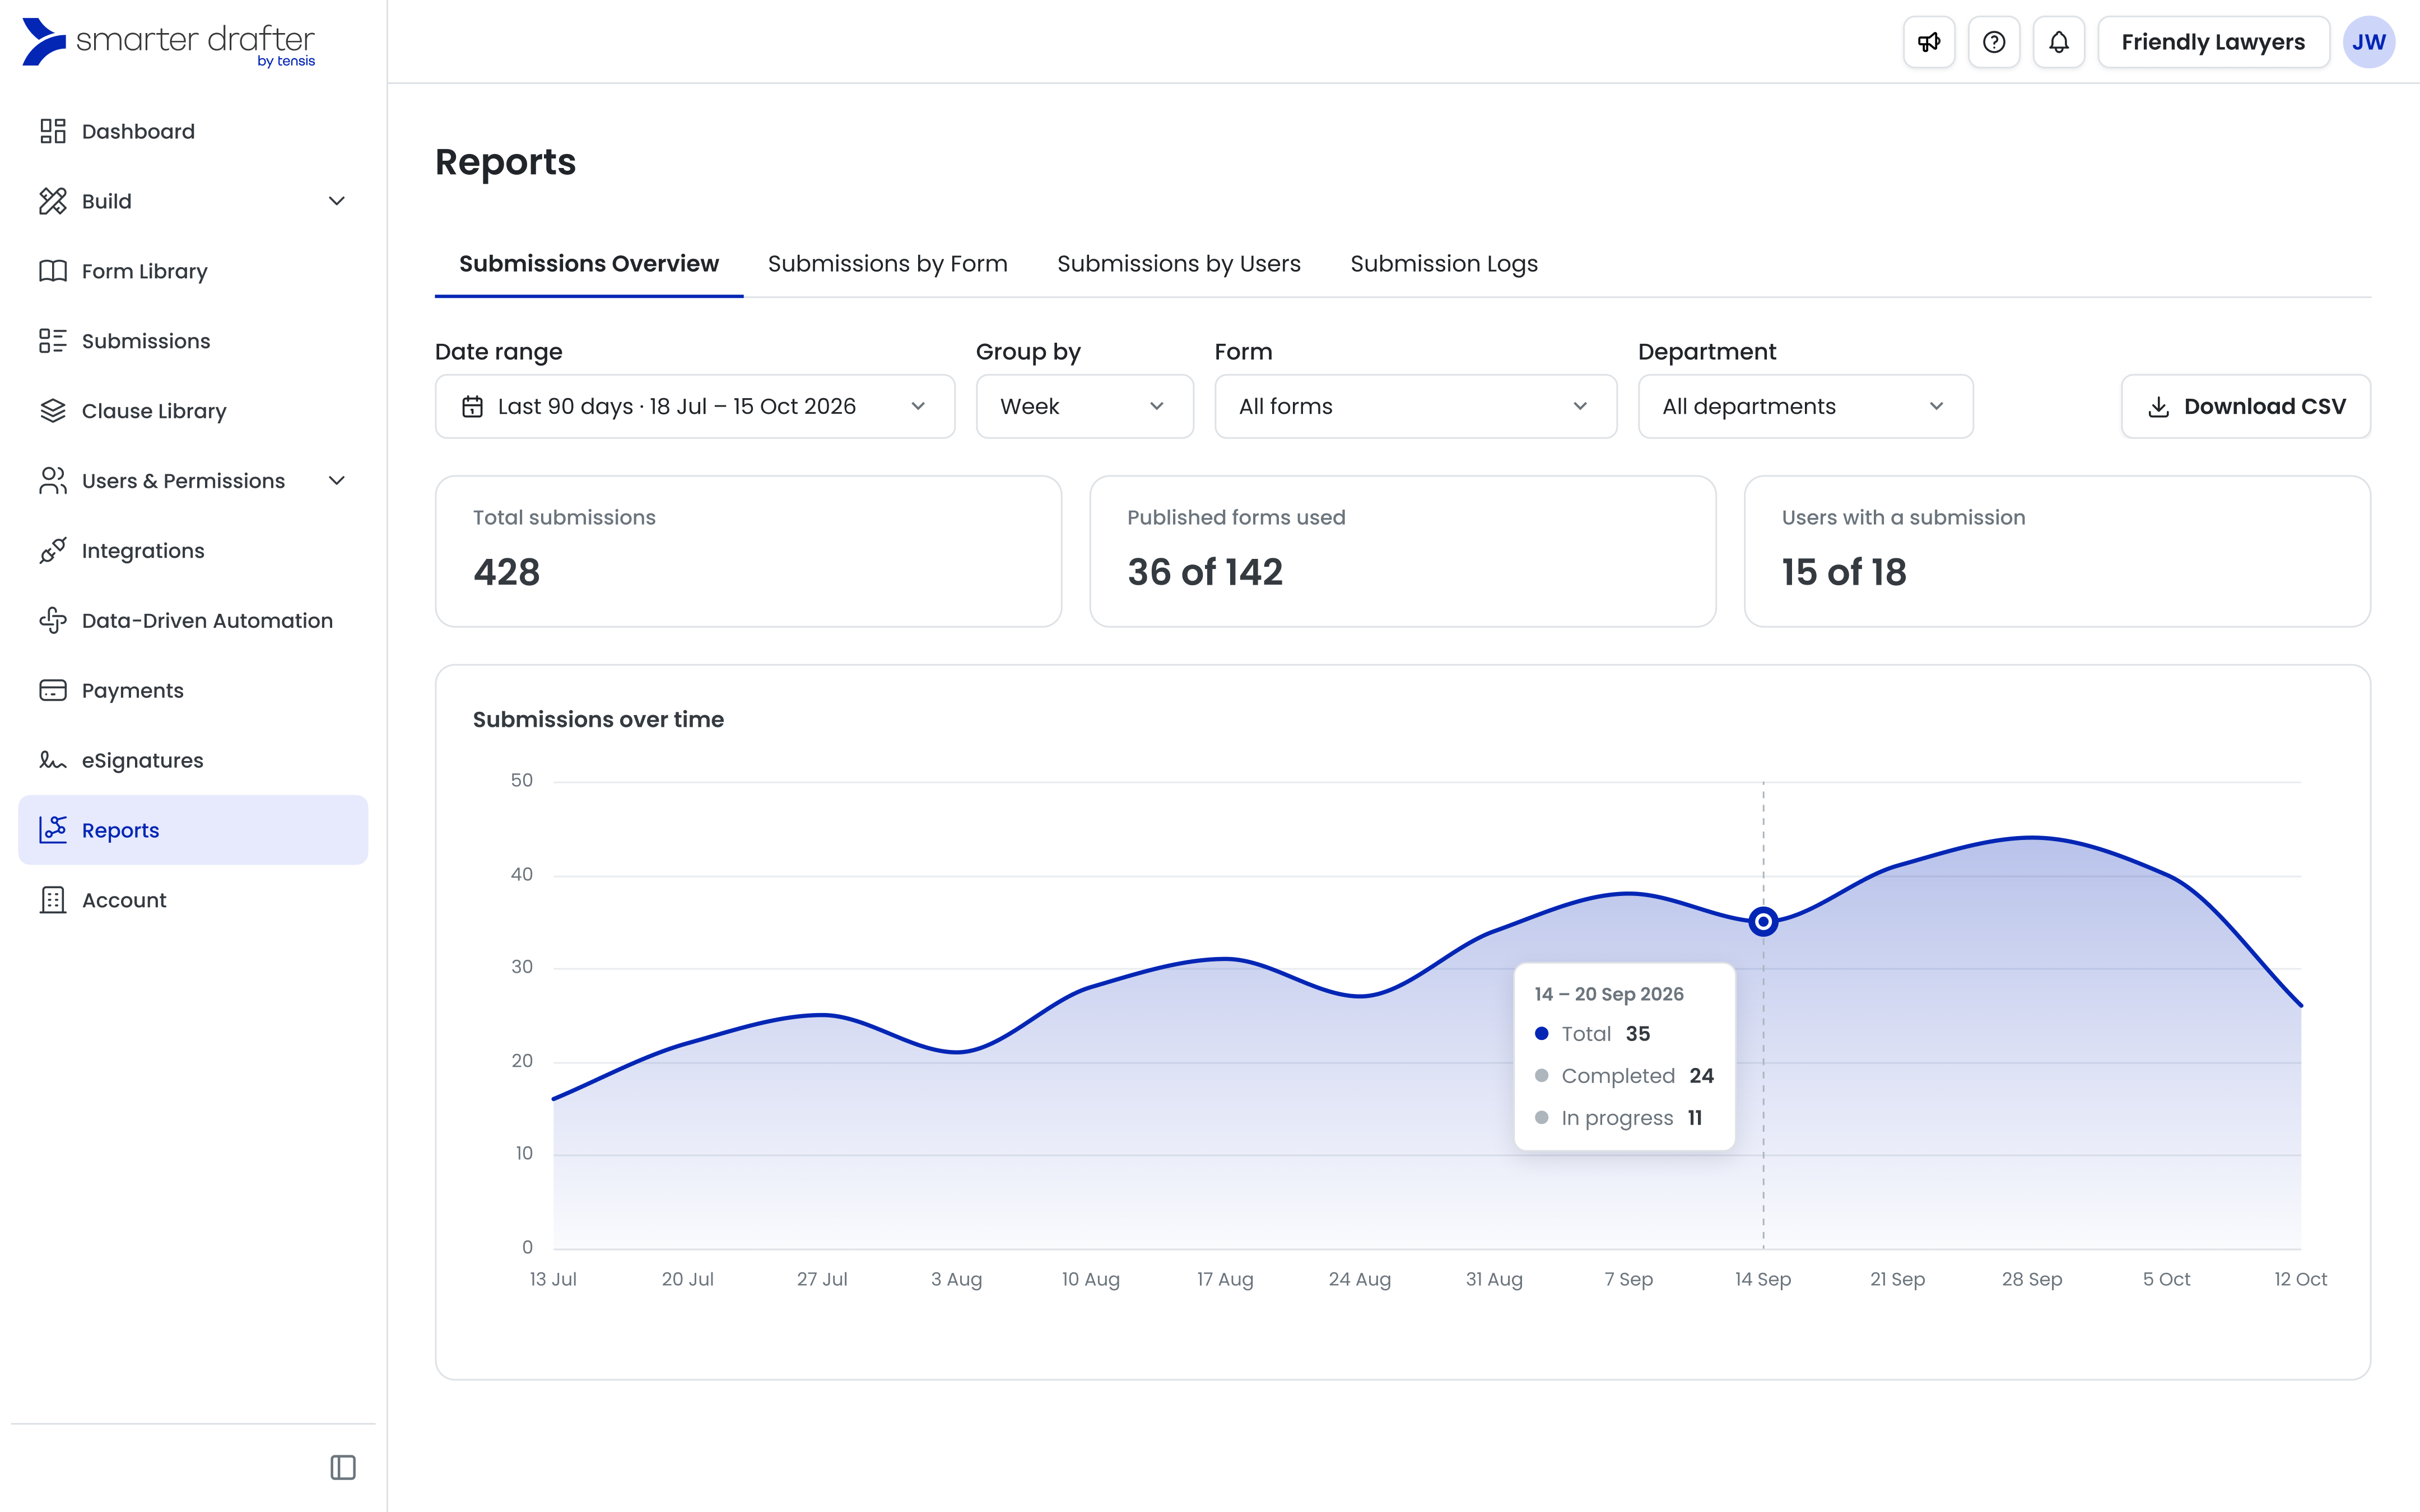
Shows how many submissions your firm creates over time and how many of your forms and users are active.
- Total submissions: All in progress and completed submissions in the range.
- Published forms used: How many of your published forms have at least one submission in the range, e.g. “36 of 142”.
- Users with a submission: How many of your active users created at least one submission in the range.
- Submissions over time: A chart of total submissions for each day, week, month or year. Hover over a point to see the Total, Completed and In progress counts for that period.
Submissions by Form
Lists every published form with its submissions in the range, including forms with no submissions.
- The tiles show Total submissions, Published forms used, Submissions Completed and Submissions In progress.
- The table shows each form’s folder, number of submissions, number of unique users and last submission date.
- Click a Unique users number to see who used that form and how many submissions each person made.
- To filter by folder, use the Form folder column header.
- To include deleted forms that have submissions in the range, open Filters and turn on Show deleted forms. Deleted forms show a Deleted badge.
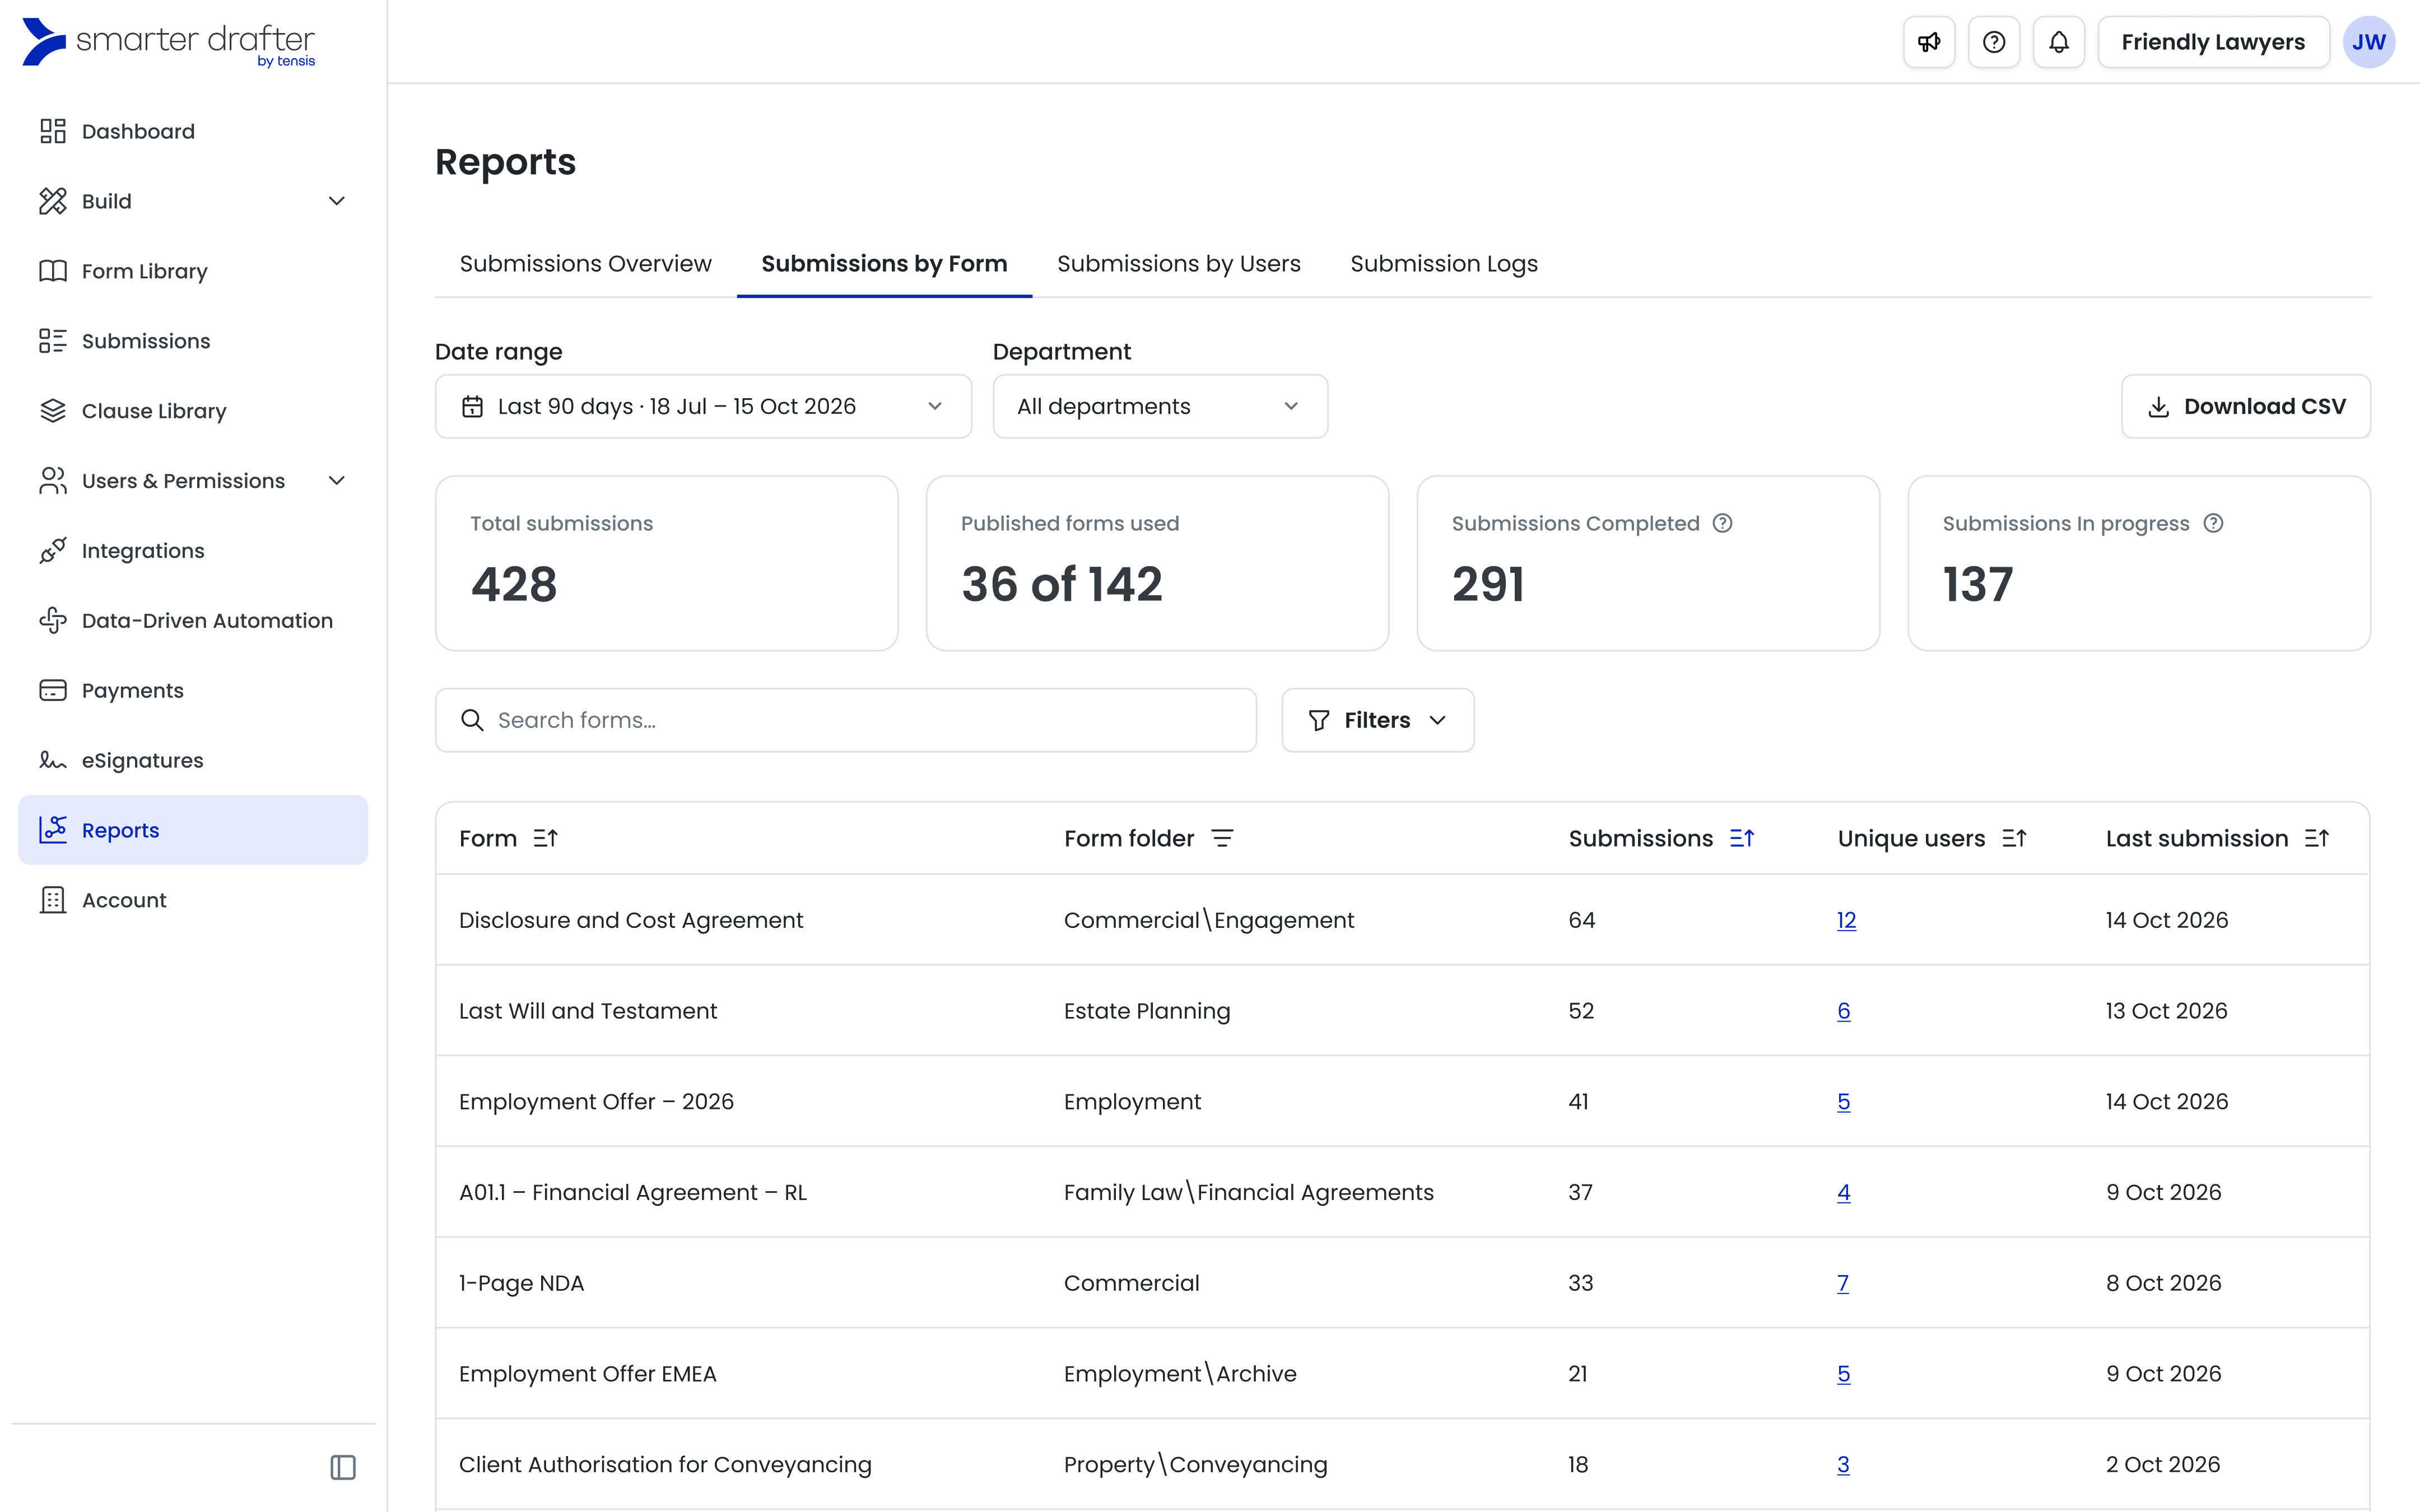
Download CSV exports the table as it appears on screen, including the form ID and whether each form is deleted.
Submission by Users
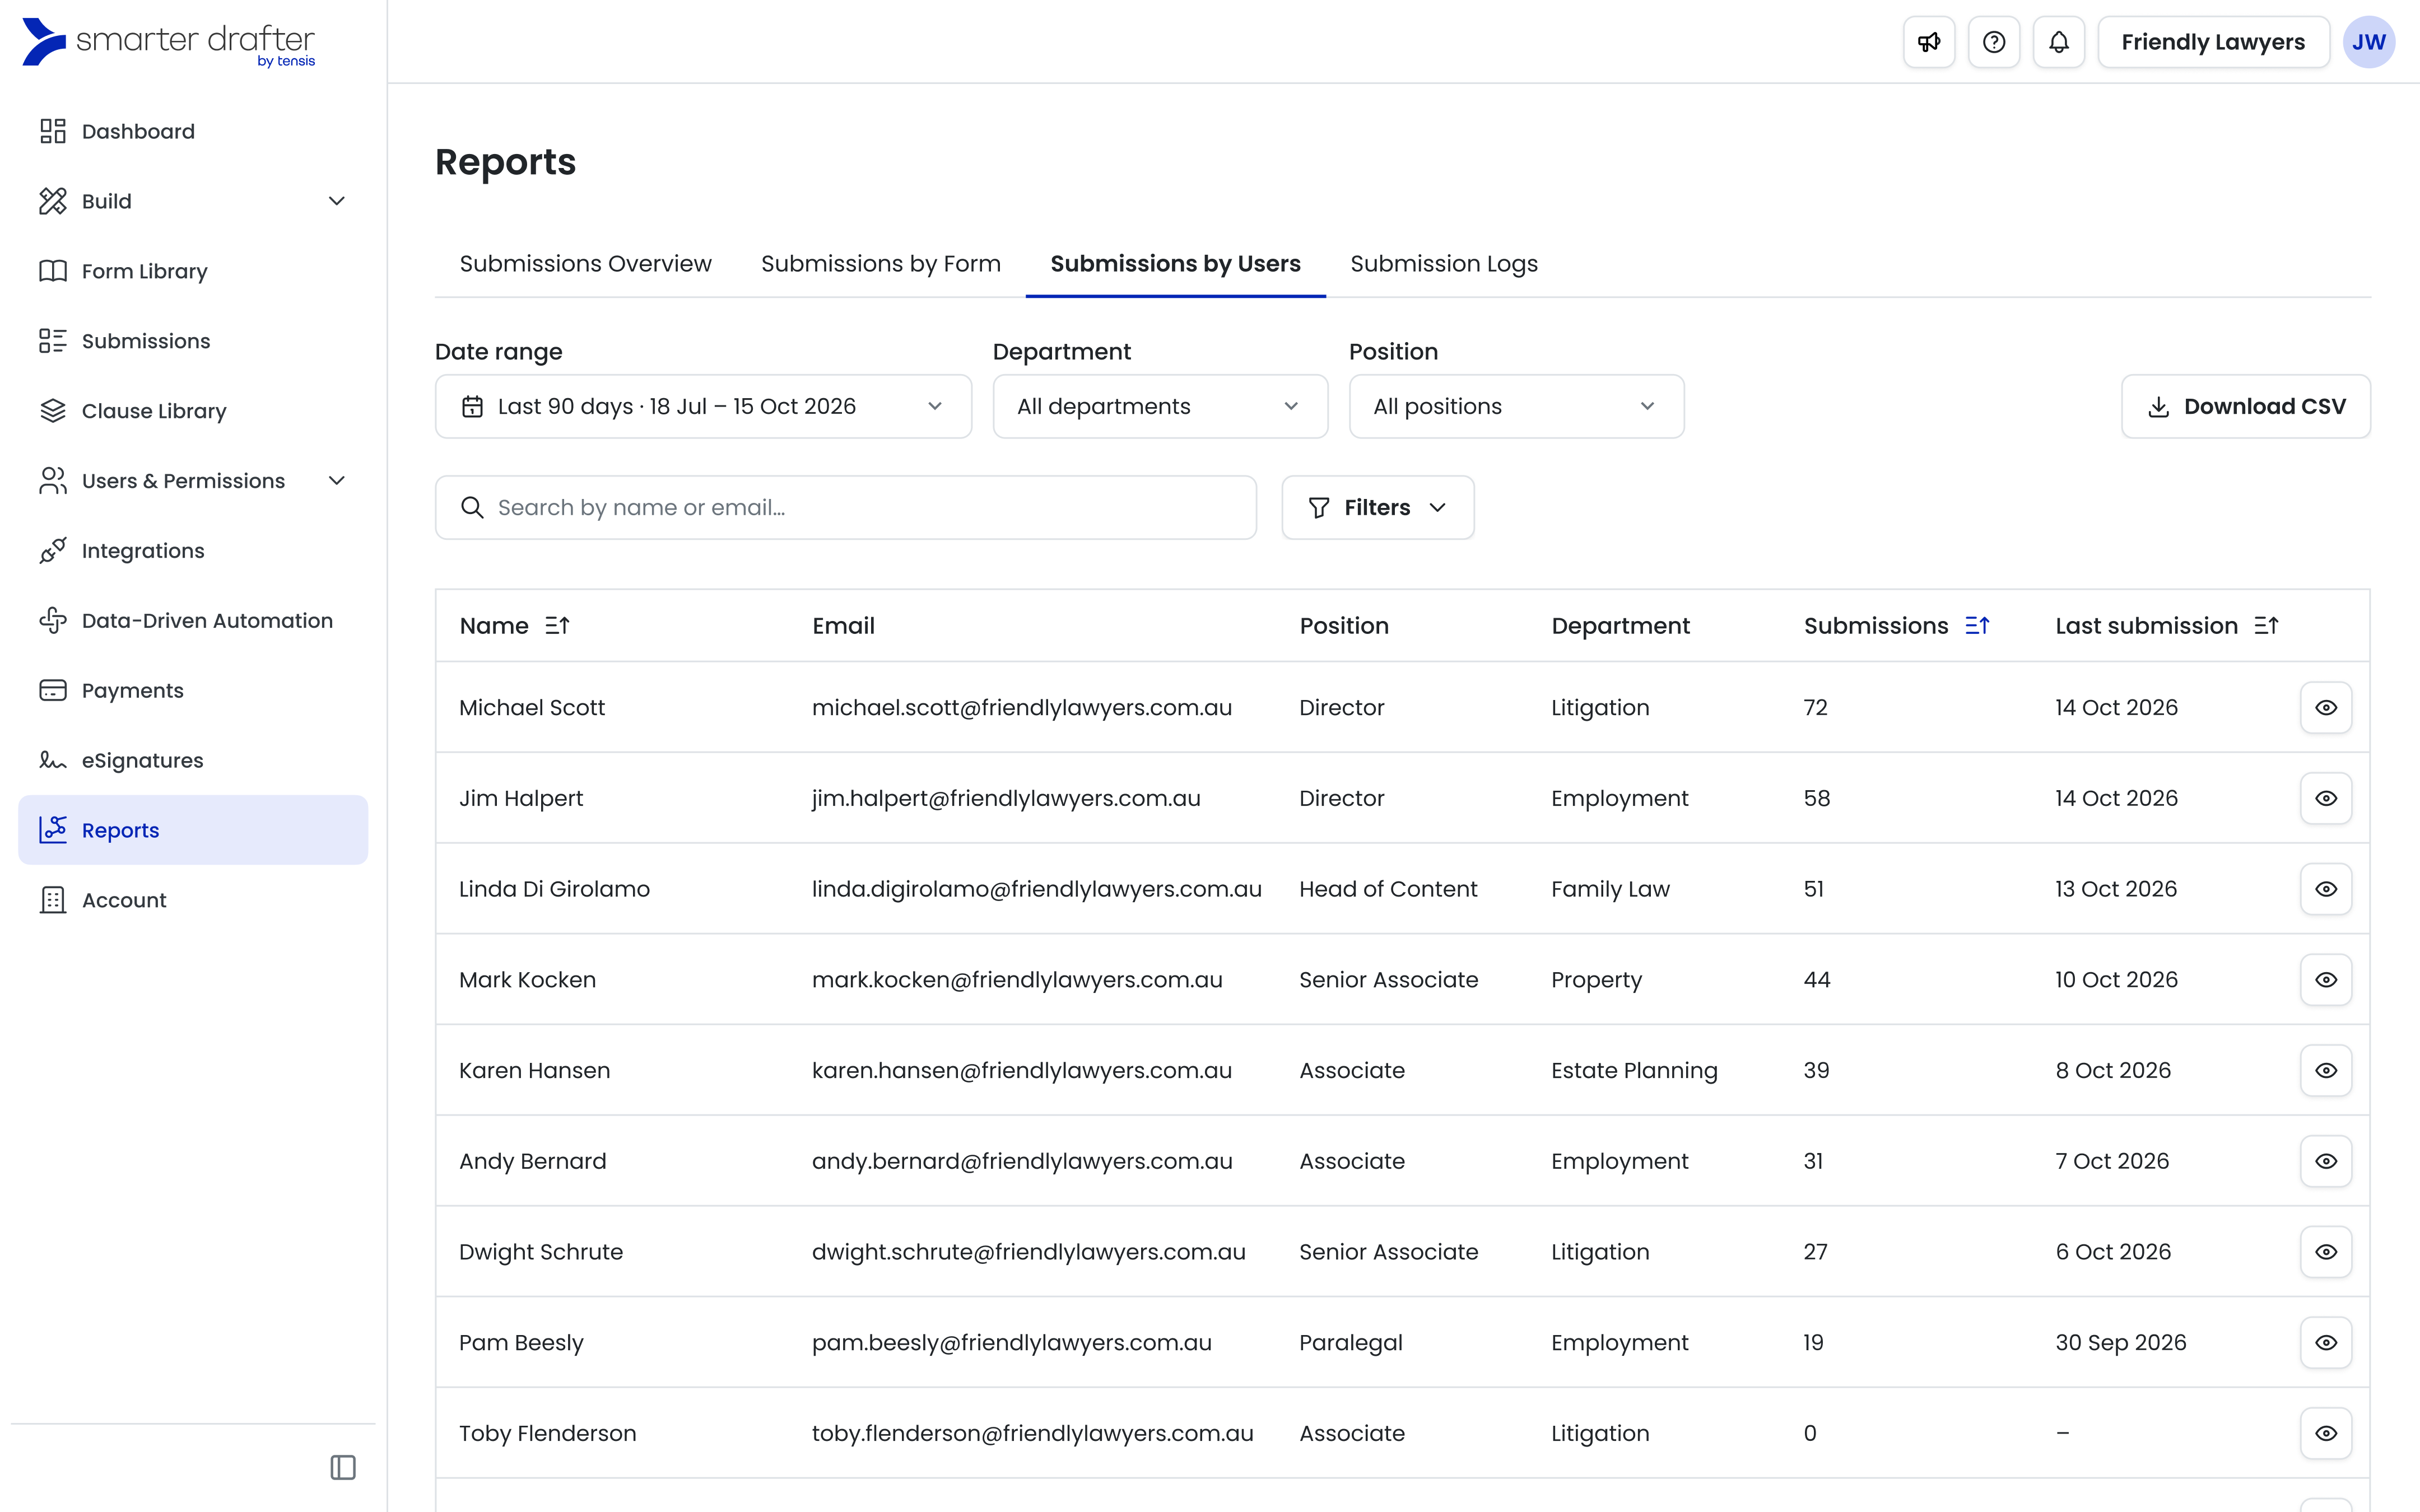
Lists every active user with their submissions in the range, including users with no submissions.
- The table shows each user’s email, position, department, number of submissions and last submission date.
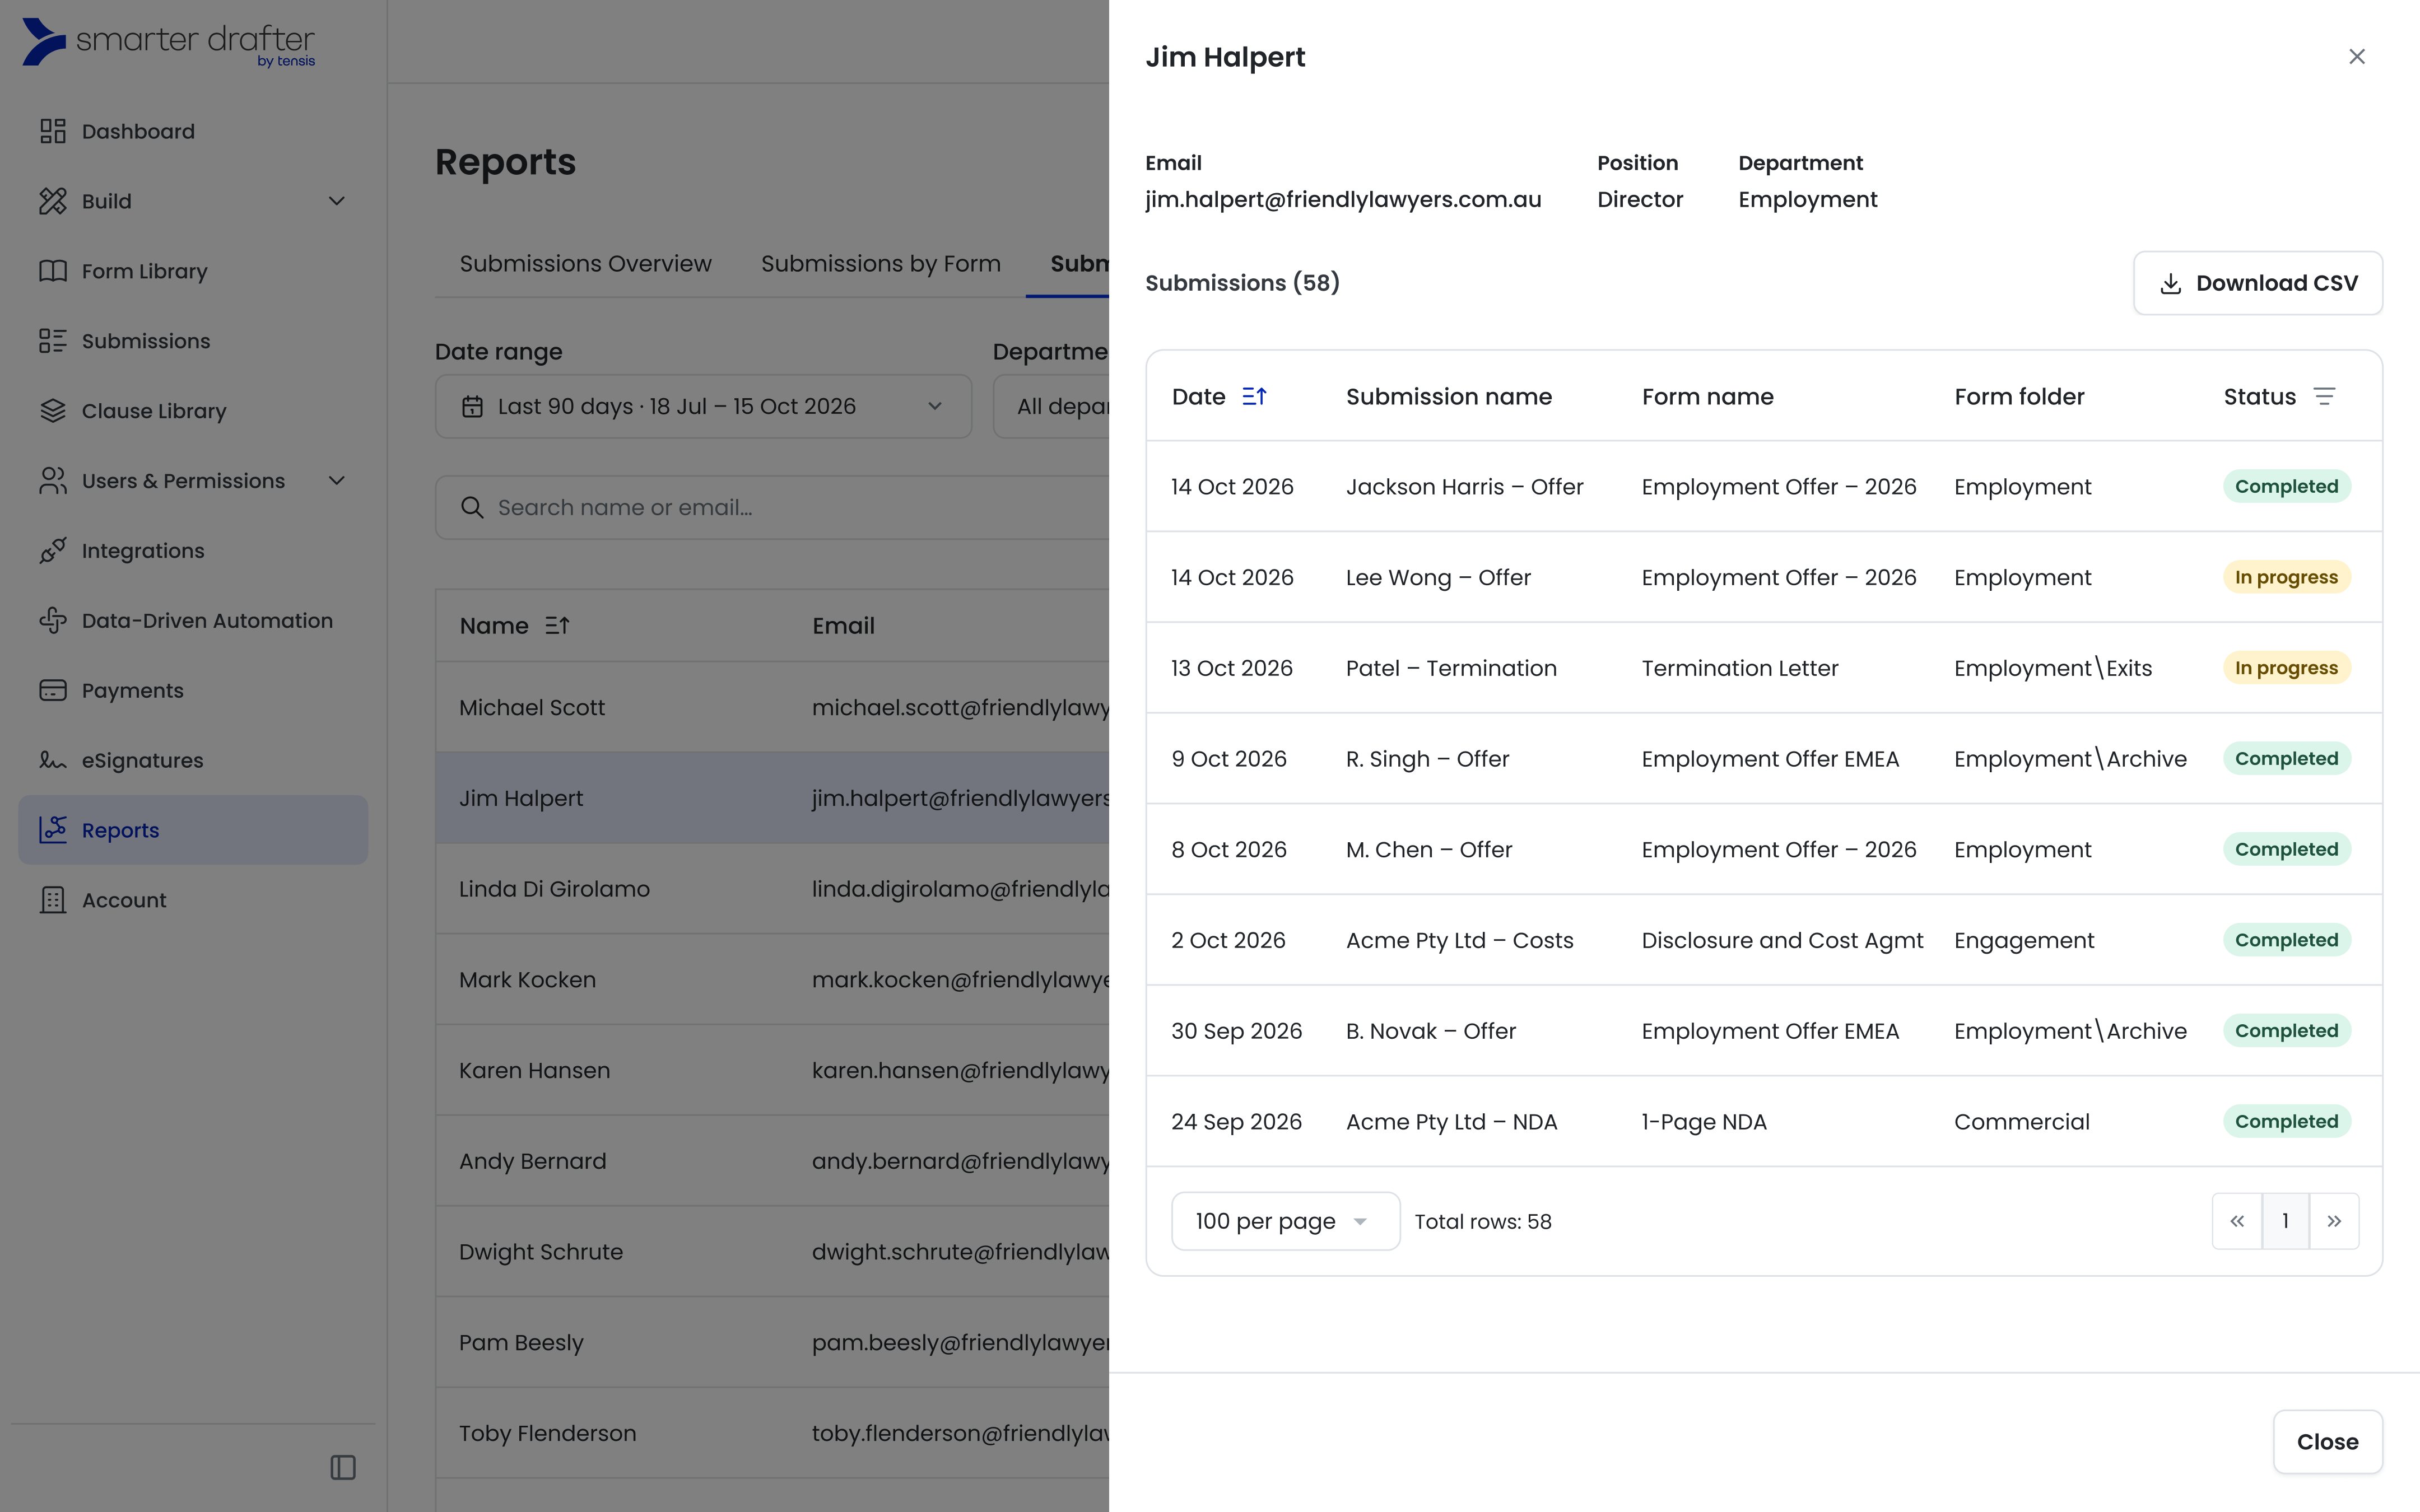
- Click a row, or its view (eye) icon, to open that user’s submissions in a side panel. Each submission shows as Completed or In progress.
- Click Download CSV in the side panel to download that user’s submissions only.
Note: Position and Department come from each user’s profile. If they’re blank, the table shows as empty and the Department and Position filters can’t include those users.
Submission Logs
Download a detailed history of your firm’s submissions and intakes. This page has no table or chart. The date range is the only filter.
- Submission logs: One row for every event on a submission. This includes when it was started, edited, submitted, generated, downloaded, viewed, cloned, sent for signature, sent to an integration, deleted or restored, and when its matter changed. Each row shows the submission, its form, who owns it and who performed the event. Use it to check a submission’s full history.
- Intake logs: One row for every intake event. This includes when an intake was sent to a recipient, completed by the recipient or on their behalf, sent back, submitted, deleted or restored. Each row shows who sent the intake, who received it and who performed each action.
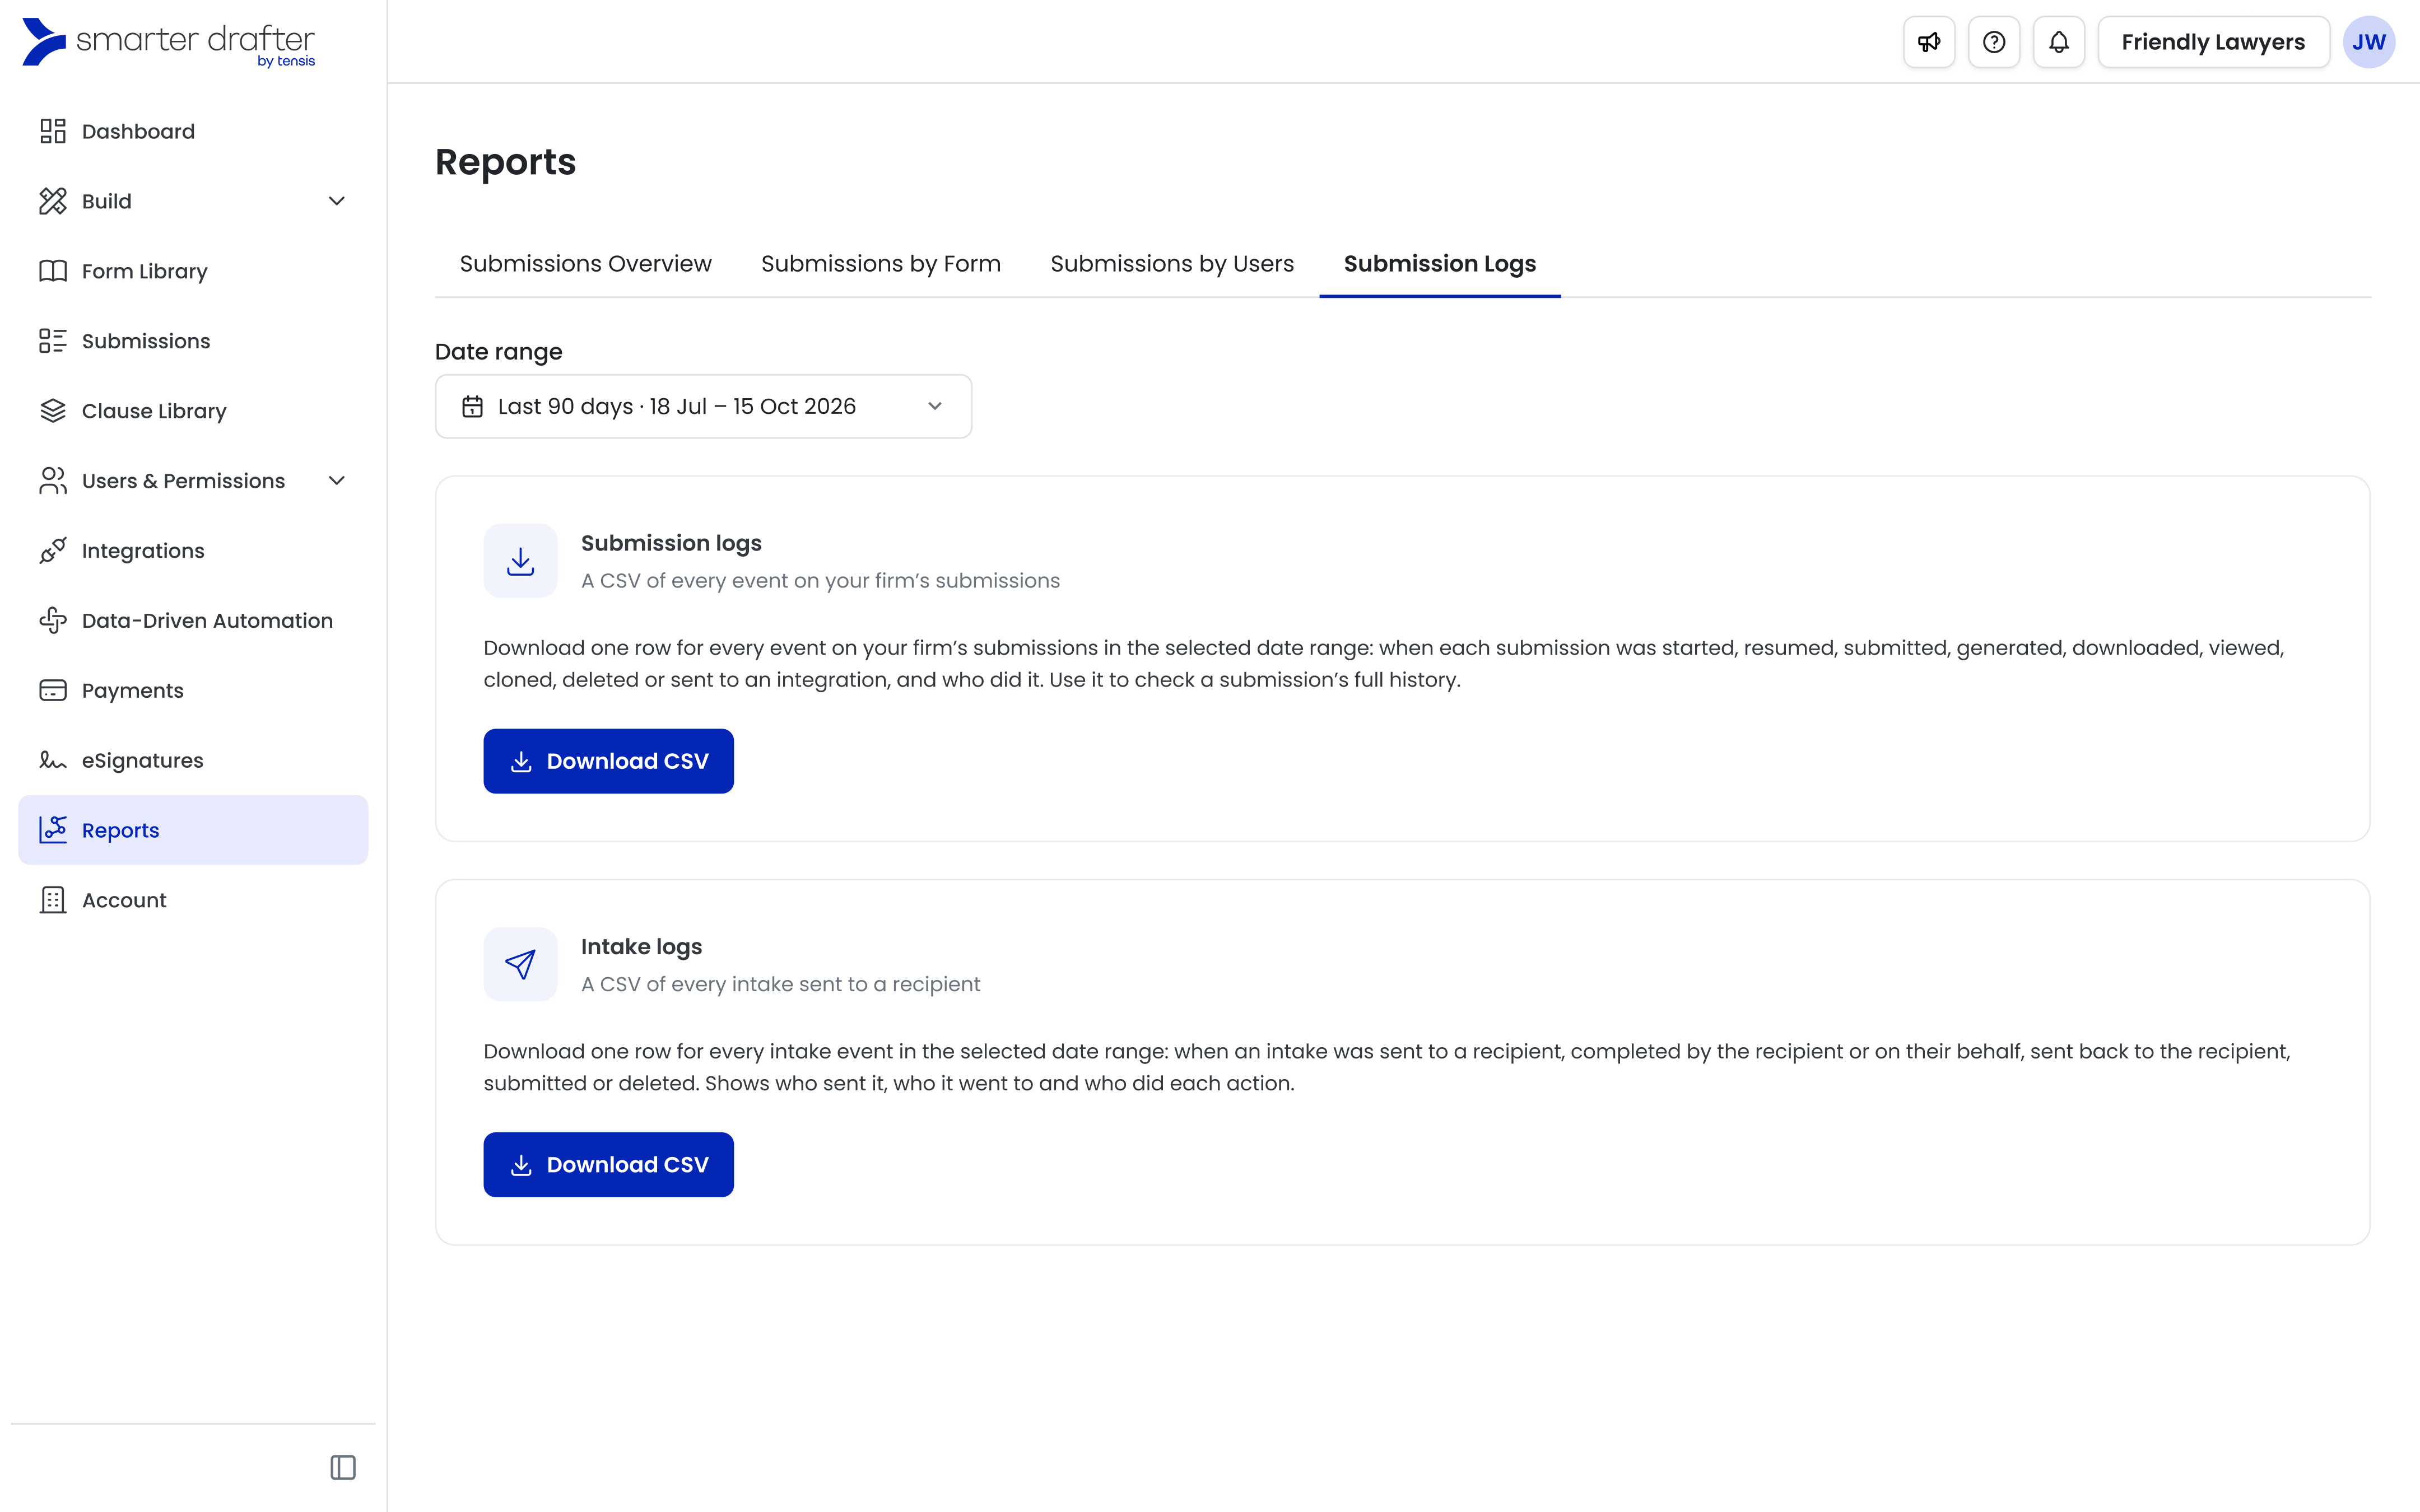
You can always download both logs. If there are no events in the range, the file contains column headers only.
Common questions
Q: What counts as a submission?
A: Reports counts in progress and completed submissions. In progress means Started, Saved or Pending. Completed means the document was generated, or the submission was submitted on a form that doesn’t produce a document. Failed and deleted submissions aren’t counted.
Q: Are test submissions counted?
A: No. Test submissions are left out of every tile, chart, table and CSV. Some older test submissions weren’t marked as tests when they were created, so figures for older date ranges may still include a few.
Q: Which date is a submission counted on?
A: The date it reached its current status, using your firm’s timezone. For example, a submission started in September and completed in October counts in October.
Q: Why don’t my numbers match the old Reports or earlier exports?
A: Reports now leaves out test, failed and deleted submissions. It also counts each submission on the date it reached its current status and uses your firm’s timezone instead of UTC. Your figures will usually be lower and more accurate.
Q: Are submissions on deleted forms still counted?
A: Yes. They count in every tile, chart and CSV. On Submissions by Form, a deleted form’s row only shows when Show deleted forms is on. Managed content forms removed from your firm are treated as deleted forms. Their submissions stop counting once the form is permanently deleted from the recycle bin after 90 days.
Q: Are deactivated users’ submissions still counted?
A: Yes, their submissions still count in the totals. Deactivated users are hidden from the Submissions by Users table unless you turn on Show deactivated users via the filter, and they aren’t included in the Users with a submission tile.
Q: Why don’t the table rows add up to the tiles?
A: The tiles always include deleted forms and deactivated users, even when the table hides them. Search and the Form folder filter also change the table but not the tiles.
Q: What do “System” and “Clients API” mean in the logs?
A: The Performed by column shows who carried out each event. “System” means Smarter Drafter did it automatically, such as generating a document. “Clients API” means the event came through an integration that uses the Clients API. In the intake log, “Recipient” means the intake recipient performed the action.
Q: Why is Group by greyed out, or missing some options?
A: The options depend on the length of the date range. Ranges of 14 days or less always show by day. Day is only available for ranges up to 30 days, Month for ranges longer than 30 days, and Year for ranges longer than 12 months.
Q: What format are the CSV files in?
A: Every CSV matches what’s on screen, including your filters, search and sort. Dates use YYYY-MM-DD format, times use your firm’s timezone, and the file name includes the report and date range.
Q: Where has the Payments report gone?
A: It has been removed from Reports. To export payments, go to Payments in the sidebar and click Export to CSV.